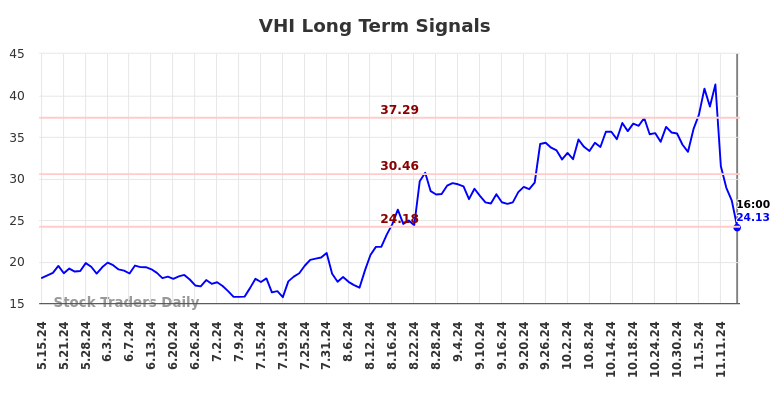
Learn to Evaluate (VHI) using the Charts
Stock Traders Daily
Publish date:
Stock Traders Daily has produced this trading report using a proprietary method. This methodology seeks to optimize the entry and exit levels to maximize results and limit risk, and it is also applied to Index options, ETFs, and futures for our subscribers. This report optimizes trading in Valhi Inc. (NYSE: VHI) with integrated risk controls.
Warning:
The trading plans were valid at the time this was published, but the support and resistance levels for VHI change as time passes, and this should be updated in real time. Access those real time updates for this and 1000 other stocks here. Unlimited Real Time Reports
Protection from Market Crashes: Subscribers also get our Tail Risk hedge, Evitar Corte
Instructions:
Use the basic rules of Technical Analysis. Here are some examples: if VHI is testing support the signal is to buy and target resistance. On the other hand, if resistance is tested, that is a sign to short, and target support. No matter which side the trade is, long or short, the trigger point is both a place to enter and as a risk control.
Swing Trades, Day Trades, and Longer term Trading Plans:
This data can be used to define Day Trading, Swing Trading, and Long Term Investing plans for VHI too. All of these are offered here: Access our Real Time Trading Plans
Longer Term Trading Plans for VHI
- NONE.
- Short VHI slightly under 24.18, target n/a, stop loss @ 24.25
Swing Trading Plans for VHI
- Buy VHI slightly over 24.18, target 25.98, Stop Loss @ 24.11
- Short VHI slightly near 24.18, target n/a, Stop Loss @ 24.25.
Day Trading Plans for VHI
- Buy VHI slightly over 24.18, target 25.38, Stop Loss @ 24.12
- Short VHI slightly near 24.18, target 20.73, Stop Loss @ 24.24.
VHI Technical Summary | Raw Data for the Trading Plans
| Term → | Near | Mid | Long |
|---|---|---|---|
| Bias | Weak | Weak | Strong |
| P1 | 0 | 0 | 24.18 |
| P2 | 20.73 | 25.98 | 30.46 |
| P3 | 25.38 | 34.55 | 37.29 |


