Day Trading from Daily Charts
TheStockBandit
Publish date: Wed, 31 Aug 2011, 10:16 AM
The daily charts are where nearly all my trades originate.'' Whether I’m looking for a single-day move or one that lasts several weeks, I always at least take the daily chart into consideration.
Day traders often forget the value that the daily chart can bring.'' The conclusion is that it’s only suitable for swing trading or position trading, but the truth is that the daily chart can offer some good signals for entry and exit as levels are cleared or reached.'' Even better, those same levels can often add to your confidence in a day trade and help you stay in it.
Let me offer 3 examples from Tuesday’s session where the daily charts played important roles.'' On Monday night in the member area, I listed only 3 plays for Tuesday’s session, with each of them being day trade candidates.'' I’ll break them down one at a time with the initial setup, and then a look at Tuesday’s intraday chart where the daily level played a significant role.
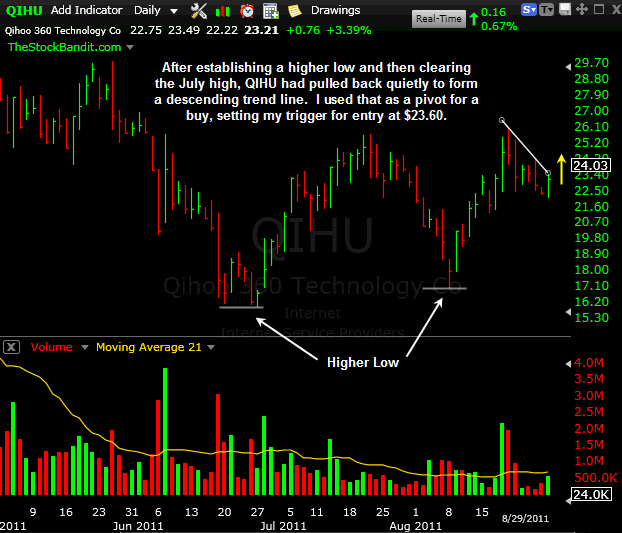
First up was QIHU, which looked poised for a push higher after establishing both a higher low and a higher high in recent weeks.'' The pullback over the previous several sessions provided a clean descending trend line which I used as a pivot for getting long at $23.60. Here was the original setup:
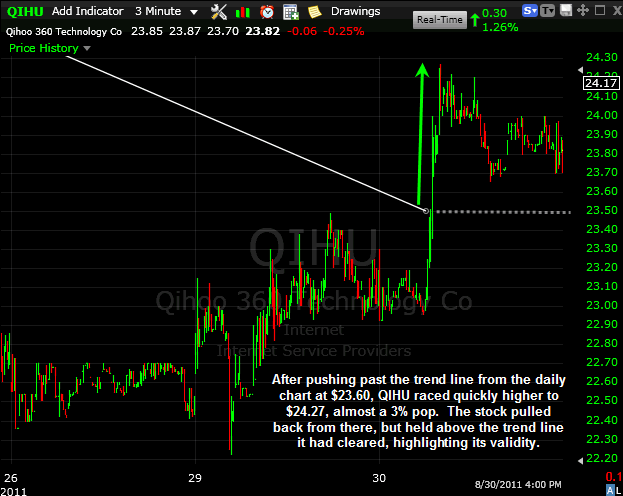
QIHU pushed past that trend line and never dealt with it again, running initially almost 3% higher before pulling back but still holding above that same trend line:
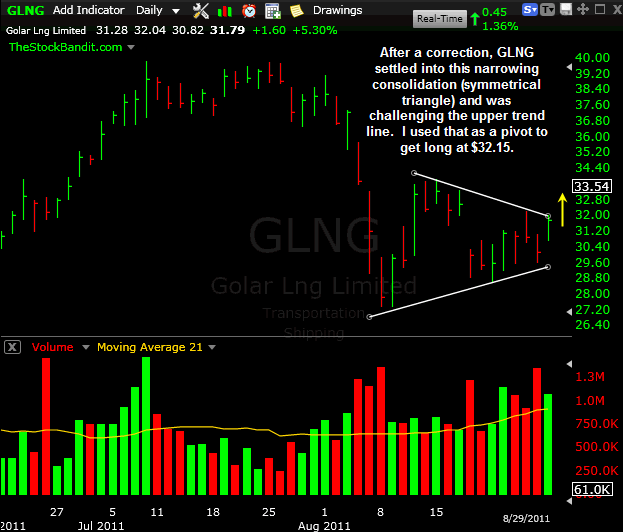
Next up was GLNG, which had corrected and then settled into a multi-week narrowing consolidation pattern in the form of a symmetrical triangle.'' These patterns can break either way, and with a strong market and the upper trend line being challenged, I was looking long on a trend line break through $32.15:
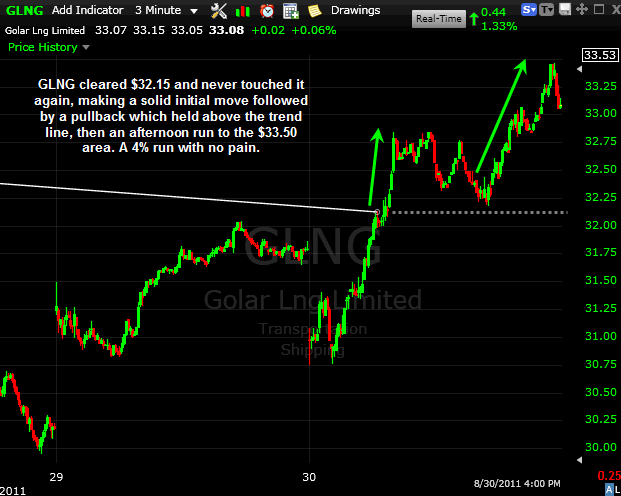
GLNG triggered an entry as it cleared the $32.15 level, showing a nice initial pop followed by a pullback to test the breakout zone.'' To heighten the validity of the $32.15 level, the low of the pullback was $32.18, just 3 cents above it.'' From there, it ran again in the afternoon to clear the morning highs and get 4% beyond the morning trigger.'' Not bad for a few hours and no pain:
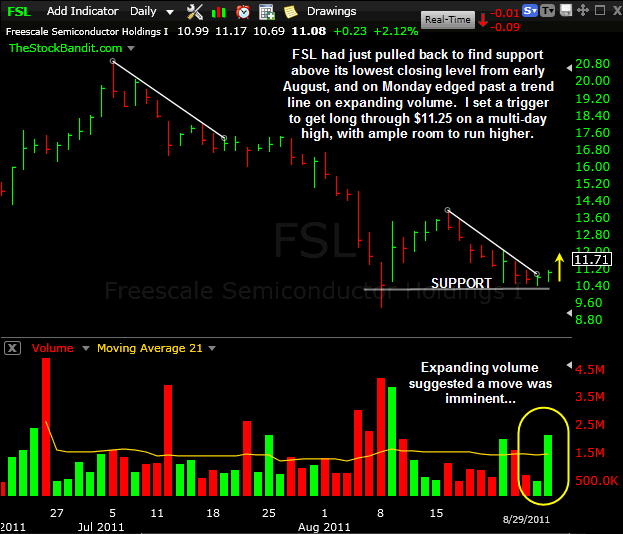
Last but not least was FSL, a little stock which had huge potential.'' It had just pulled back to test and hold the early-August closing low, and in recent days had stabilized just above that level.'' On Monday it saw expanding volume but only minimal progress as it edged past a descending trend line.'' I set a trigger for $11.25, which would be a multi-day high, to get long.'' Here’s a look at the pre-trade setup:
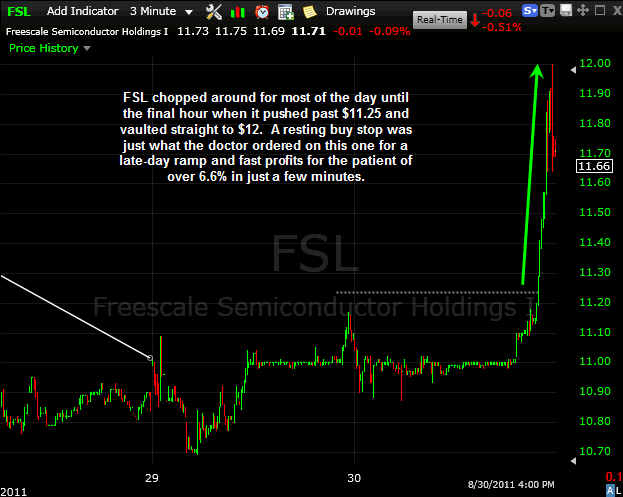
FSL triggered late in the day with a massive thrust higher once it cleared the $11.25 level, vaulting straight up to $12 to offer a very fast 6.6%.'' The move was fast and furious, but a quick payoff once the level was cleared:
A couple lessons from these trades…
A level is a level. Doesn’t matter if you found it on the daily chart or some other timeframe, the odds are it’s going to be evident across multiple timeframes.'' Recognize and respect that, because it could pay quite well.'' All 3 of these trades were winners, and each of them respected the level originally found on the daily chart.
Keep an open mind.'' Perhaps your preference for day trades is a 15-minute chart or a 30 or a 5-minute chart.'' That’s great.'' But keep an open mind about how trades might originate.'' Don’t resign the daily charts to something only multi-day traders consider.'' You’re missing out on several great opportunities per day by ignoring the daily charts.
Hopefully you found this walk-through helpful.'' If you want to know what I’m trading tomorrow, stop by the site and begin your trial to our stock pick service.
Trade Like a Bandit!
Jeff White


