When Resistance Becomes Support
TheStockBandit
Publish date: Tue, 11 Sep 2012, 02:25 PM
Levels on a chart become more valid with every touch.'' Whether it’s a trend line or a lateral level, each time price respects it, it adds credibility.
One thing I watch for frequently is for lateral support/resistance levels, and specifically when they’ve flip-flopped their roles.'' By that I mean a level which had been support which has become resistance, or vice-versa.'' That tells me that both bulls and bears alike can at least agree on that price area being important.
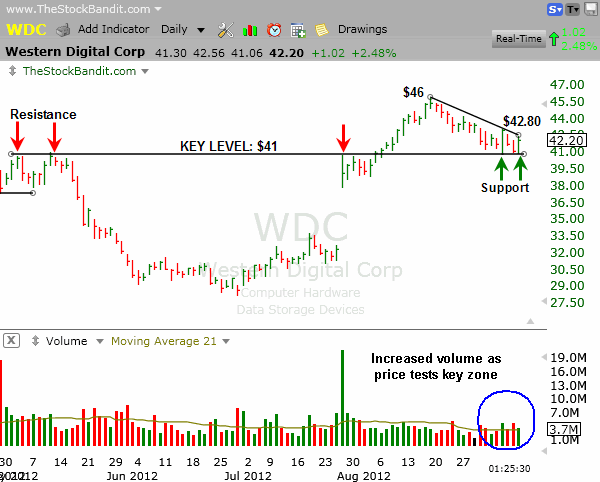
I ran across a chart today which is doing this very thing.'' WDC respected the $41 area back in mid May, then again in late July.'' The stock powered through that level in early August, but in recent days it has pulled back to find support there.'' We’ve also seen elevated volume in recent sessions as that level has been tested, suggesting this is indeed an area of contention.
Since the peak more than three weeks ago, a descending trend line off the high has also emerged.'' Currently that trend line and the $41 key level are starting to compress price.'' A resolution one way or another should set the stage for the next move.
Given that the intermediate term trend is up, watch the descending trend line for a possible break, currently around $42.80 (it descends daily).'' That may deliver some upside pressure back toward the high near $46.
The $41 level would be the natural zone to watch for a failure, but on a reward-to-risk basis that only offers about 2 to 1.'' That doesn’t qualify for me for a swing trading candidate, but the chart nonetheless is worth pointing out as it gives such a good example of a key level playing a role from both sides of price.
Here’s a closer look at the chart of WDC for you:

Trade Like a Bandit!
Jeff White
Subscribe to our Stock Pick Service to get our trades.


